


How to Enable and Use Diagnostic Data Viewer in Windows 10
By Timothy Tibbettson 06/15/2023 |
Windows 10 collect diagnostic data, but as of Windows 10 version 1803 and later, you can now not only turn Diagnostic Data on or off; you can also use Diagnostic Data Viewer to view the information collected and even diagnose some problems. Here's how.
Go to your Control Panel, Privacy, Diagnostics & feedback. Toggle the switch On under View diagnostic data.
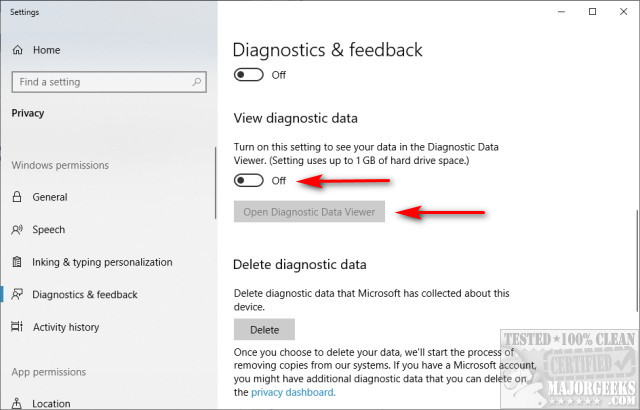
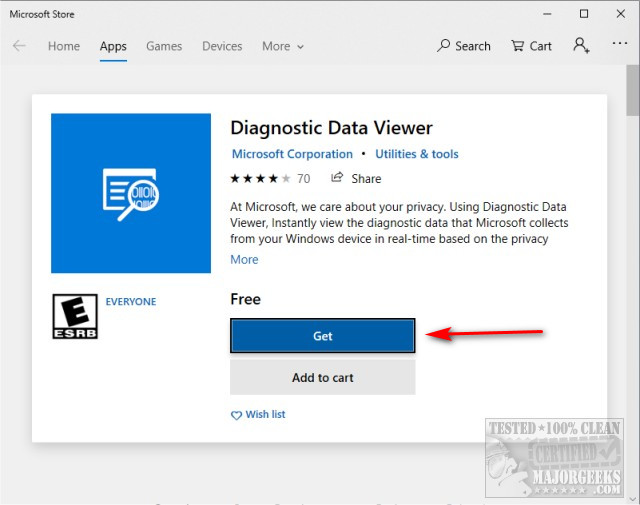
Next, click on Open Diagnostic Data Viewer. You will be directed to the Microsoft Store to download the Diagnostic Data Viewer. Click on Get, then Install.
Once installed, go back to your Control Panel and click on Open Diagnostic Data Viewer.
Next, to the Refresh icon, you will find event category filter options. The icon looks like a funnel.
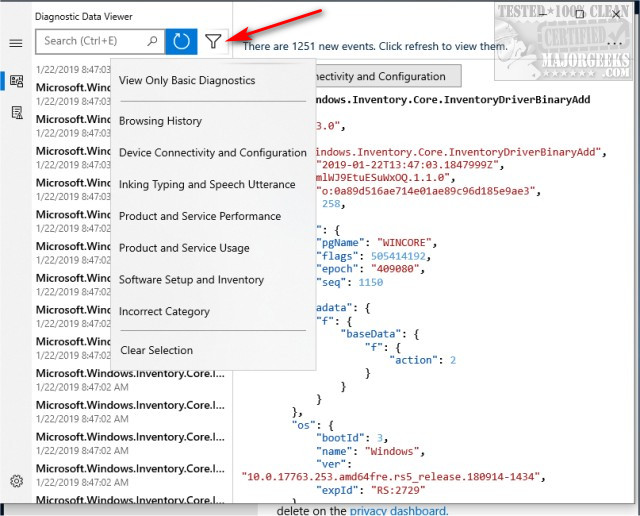
Event categories include:
Browsing history
Device Connectivity and Configuration
Inking Typing and Speech Utterance
Product and Service Performance
Product and Service Usage
Software Setup and Inventory
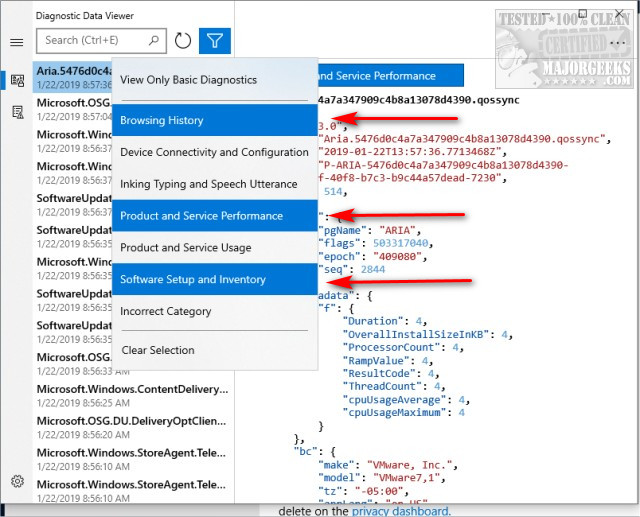
You can click on as many as you like. The color of the selected categories will turn blue, so you know what you've filtered out.
On the far upper left, you will find two other icons that switch between View problem reports and back to the Diagnostic Data Viewer.
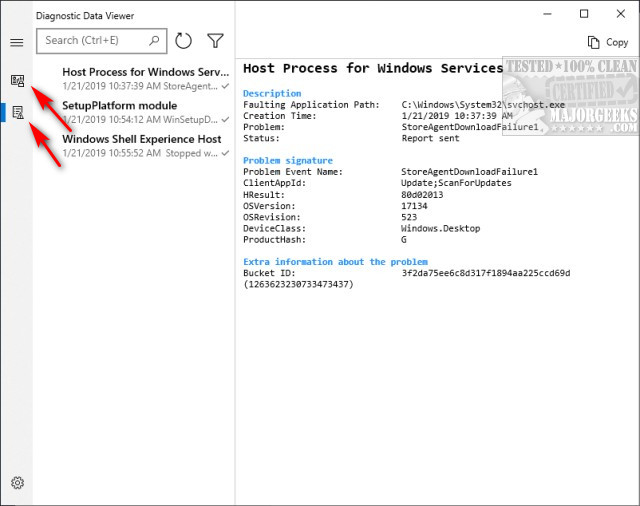
Finally, click on the three dots in the top right corner, and you can export your data to CSV.
We've always left Diagnostic Data Viewer off. Diagnostic Data Viewer both takes up space and resources, but that's up to you.
Similar:
How to Delete Diagnostic Data in Windows 10
How to Turn Diagnostic Data Settings on or off in Windows 10
How to Use the Microsoft Support Diagnostic Tool & System Diagnostic Report
Windows Could Not Start the Diagnostic Policy Service
comments powered by Disqus
Go to your Control Panel, Privacy, Diagnostics & feedback. Toggle the switch On under View diagnostic data.
Next, click on Open Diagnostic Data Viewer. You will be directed to the Microsoft Store to download the Diagnostic Data Viewer. Click on Get, then Install.
Once installed, go back to your Control Panel and click on Open Diagnostic Data Viewer.
Next, to the Refresh icon, you will find event category filter options. The icon looks like a funnel.
Event categories include:
You can click on as many as you like. The color of the selected categories will turn blue, so you know what you've filtered out.
On the far upper left, you will find two other icons that switch between View problem reports and back to the Diagnostic Data Viewer.
Finally, click on the three dots in the top right corner, and you can export your data to CSV.
We've always left Diagnostic Data Viewer off. Diagnostic Data Viewer both takes up space and resources, but that's up to you.
Similar:
comments powered by Disqus
